
Share this page!

Custom Search
|
Click here to select another year
November 12th, 2015---: Not much activity here on my NYC blog this year, mainly because we just didn't have all that much activity to talk about over the summer. Our thunderstorm season was another dud, and that's an understatement. Aside from the early morning of August 4th, we haven't had any decent thunderstorm days here in NYC all summer and fall. Many other locations further to our north and west saw a few decent days, but not here in the city itself. This really has been the norm for many years now (with the exception of 2011). The nearby ocean more times than not wipes out all the instability in the immediate NYC Metro, and in turn, any thunderstorms that approach us from the west, have a tendency to weaken rapidly. Cold fronts that approach from the northwest usually give us a better shot of storms here, as the prevailing low level winds during those times is more out of the west or west southwest (ie, not directly off the stable ocean). We'll see what 2016 will bring, but now that we settle further into the Fall season, I'll start concentrating on our upcoming winter, and what impacts we could see as we move forward. Much talk has been about the record El Nino we've been seeing this year, and many people are already assuming that because of this, we'll see a warm winter, with very little snow. But that may not be the case. We are definitely in a warm pattern right now, and I think there is no doubt that November 2015 will come in MUCH above normal once all is said and done. And I wouldn't even be surprised in December came in above normal as well. But there are many signs that as we get further into the winter season, especially mid winter and beyond (Jan/Feb) we could be looking at a shift to more cold and snowy weather. Personally I'm hoping this is the case, well, the snow part of it anyways lol. I do enjoy a good blizzard, but I'm sure many people would disagree with me on that one. For more details, including an indepth analysis on what we could be looking at this upcoming winter, check out NY Metro Weather's Winter 2015-2016 Forecast
July 1st, 2015---: Summer is here, and with that, comes our summer thunderstorm season. All though, much like last year, this year's season hasn't exactly started with a bang. We did have one really good looking set up, back on June 23rd, that for a while anyway, held a lot of potential. We had a ton of instability in place, with up to 3000 MLCAPE, even here at the coast! An EML was in place, capping things off so that we could get some good heating going, and we had around 50kts of 0-6km shear. All looked great! So, what happened? Well, I'll let the great Mets at NY Metro Weather explain it!
June 26, 2015/in Short Term Forecast /by Doug Simonian
“Them’s the breaks”, my father often says when things don’t quite go as planned. While this grammatically errant statement may not seem immediately applicable to meteorology, most of our staff were thinking something similar on Tuesday afternoon. Our meteorologists had forecasted an organized — potentially significant — severe weather event days in advance. While this event did in fact occur over New England, Southern New Jersey, and the Mid Atlantic, the brunt of the severe storms curiously “skipped” over New York City and much of Northern New Jersey as well.
Severe thunderstorm events, inherently, are difficult to forecast. Not only for their technical aspects and intricacies, but for their often isolated nature. One town may see wind damage and hail, while the next one down the road only sees light rain — or in some cases, no rain at all. What this means for forecasters is that communicating the scattered nature of thunderstorms becomes very important.
This time, however, the storms weren’t necessarily scattered in nature. The atmospheric pattern favored widespread thunderstorm development, with lines and bowing segments of severe thunderstorms moving from northwest to southeast while affecting a large area. Hence, our verbiage “Widespread organized severe weather”.
On Tuesday morning, the forecast immediately took a twist and turn from what we expected. Along a pre-frontal trough came rolling a remnant MCS (Mesoscale Convective System) from the night before in the Ohio Valley. This MCS shifted eastward through Pennsylvania. Our forecasters were confident that it would dissipate on its trek east before it made it to our area. A weakening low level jet and capped atmosphere meant that storms would struggle to maintain themselves. And, reluctantly, the system died — with only some leftover clouds reaching us.
Trouble, however, came when a second area of storms developed near State College. Brand new updrafts developed within an area of local instability. These storms quickly turned severe and began expanding to the northeast. No forecast model correctly showed these storms — and this meant trouble for our forecasters. The system eventually made its way to Northeast Pennsylvania before dying, similarly to the first MCS.
The fundamental issue, however, was that this second round of storms had further “overturned” or stabilized the atmosphere in Northeast Pennsylvania and Southeast New York. While they didn’t stabilize our area in New Jersey and New York City, they had effectively stabilized the areas to our north and west — where all forecast models had suggested our storms would initially develop. The image above shows how the CAPE values were much lower in Northeast Pennsylvania compared to the very impressive 2,000 – 3,500 J/KG that the rest of our area had. There was also convective inhibition (blue shading) in Northeast Pennsylvania, further hindering thunderstorms from developing. Our high CAPE values would assure that storms would blossom and strengthen when they reached our area, but without thunderstorms initializing to begin with, that doesn’t matter.
And so not surprisingly, in the mid afternoon as mid level energy reached the Northeast, new thunderstorms rapidly began developing…in all areas except for Northeast Pennsylvania and Southeast New York. Fresh storms in New England and Central Pennsylvania rapidly became severe and organized while dropping southeastward, forming into the lines and bowing segments that would eventually bring widespread wind damage to the Mid Atlantic, New Jersey and New England. Philadelphia had a wind gust of 72mph, and Southern Connecticut had microbursts which produced 90-95mph winds.
In our area, local boundaries helped to touch off strong to severe thunderstorms anyway. Since the initial MCS didn’t hit our immediate area, the local boundary had plenty of atmospheric energy and instability to tap into, causing a thunderstorm to develop in Northeast New Jersey and become severe once it trekked northeast into Queens and Long Island. It dropped 1.75? diameter hail in Glen Cove, NY and 1? hail in Huntington, NY while leaving trees down in Oyster Bay, NY. Clearly, this storm further supported the idea that the ingredients were there for a widespread wind event.
But the widespread wind event which we were anticipating never occurred here, due to the stabilizing remnant thunderstorms that had tracked through Pennsylvania and New York hours before.
A reminder to all, meteorologists included, that severe thunderstorm events require a fragile set of events to occur just right. And even a dying area of showers and clouds hundreds of miles away can tip the scale on a forecast.
March 8th, 2015---: What a month February 2015 was! Definitely one for the record books, mostly because of the extreme cold we experienced here in NYC, but there was plenty of snow to be had as well. And, for the first time since 2004, we had a ton of ice on all of the NYC rivers, which I documented from several locations throughout the city. Be sure to check out my storm chasing videos page to view my latest videos! Below are some stats from February 2015 here in NYC:
February 2015 in New York City ended with an average temperature of 23.9°, which is the 10th coldest month of all time and the coldest month since January 1977 finished at 22.1° (38 years).
- It was the 3rd coldest February of all time and the coldest since February 1934 finished at 19.9°, which is the coldest, all time (81 years).
- The 2° low on February 20th was the coldest low temp after February 20 year since it was 1° on 2/25/1914.
- The 17.6° average temp for the week of 2/15-21 was the 42nd coldest week in February history and the coldest in 1979.
- If you only count from 1950, it was the 11th coldest February week, with 8 of the top 10 coming from February 1979 and the other two from 1958.
- As for late February cold, for weeks that began 2/15 or later, the week of 2/15-21 was the 3rd coldest of all time and the coldest since 1896.
- Out of close to 4,000 February days on record, 2/20/2015 is tied for 37th lowest temp at 2° - In terms of late February, that 2° is tied for 10th lowest.
- The 4° on 2/24 was the 7th coldest temperature ever after 2/23 and the coldest since it was 1° on 2/25/1914.
Finally, if we look at it from late February temps post 1950:
The 19° high on 2/20 was the 6th coldest and the 21 on 2/16 was 8th.
The 2° low on 2/20 was the 2nd coldest.
Four of the top 9 coldest late Feb lows since 1950 came from this month.
This winter also featured an extremely impressive stretch of colder than normal air which lasted in excess of 30 days.
The 15 year period from 2000 to 2015 featured an average annual snowfall in New York City of 34.0?. This is the highest 15 year average annual snowfall since the 15 year period from 1892-1907.
January 31st, 2015---: Winter Storm Watches have now been issued for the entire NYC Metro, as well as Long Island. For now the forecast calls for up to 8 inches of snow fall, but there remains many questions, the biggest one being where exactly the rain/snow/mix line sets up. As is the case many times during the winter, NYC ends up right on that battle ground, and the difference of just a few miles north or south, means the difference between a foot of snow, and just an inch or two. Another potential hazard of this winter storm is severe icing. While the current forecast doesn't call for these conditions in NYC itself, I would not be surprised if this changes in later updates. Depending on what forecast model you look at, depends on whether you will see a forecast for mostly rain here in the city, or 11 inches of snow. The latest 12z ECMWF is colder overall, and calls for more snow in NYC. The latest 12z run of the American GFS is much warmer, and calls for more mixing, and possible plain rain for a time in the city. The 12z NAM model is right on the borderline, and the latest Canadian CMC is showing more snow and less mixing. What looks likely right now is a period of snow, possibly heavy snow overnight Sunday into Monday morning. Then we could mix for a time right around the morning rush hour. This no doubt will make the morning commute a nightmare here in the city. We could then transition back to snow later in the morning. More updates will follow tomorrow morning, by then I suspect the models will have a much better handle on this storm. Regardless, plan for a really crappy Monday morning commute if you live in the NYC Metro, or anywhere in the NYC Tri-State area.
January 30th, 2015---: Not exactly a blockbuster storm for us here in NYC, but the NWS nailed it for the rest of the northeast! Even Long Island got slammed with over 2 feet of snow, up to 3 feet further out on the east end in spots! Forecasting exactly where the axis of heaviest snow will set up is near impossible more than just a few hours out. But today's media (and much of the public) demand forecasts well in advance of a storm. This will always lead to errors, in the end, nature will always keep us guessing until the last minute. With that said, we still got a hell of a storm here in NYC, up to a foot fell here in Queens, but it wasn't the 2 to potentially 3 feet of snow originally forecast, so there are those that feel it was an under achiever. No sooner however do we shovel out from that storm, we have to start preparring for what could be another significant storm this Sunday into Monday. Right now there is the usual spread in the forecast models, but the likely hood is increasing that we could potentially see another warning level event (over 6 inches of snow). If the models are still showing this tomorrow, then my confidence will rise even more. On another note, I have posted a video from the Blizzard Of 2015 in the Storm Chasing Videos section, check it out! I documented the storm from Suffolk County, LI over the course of two days.
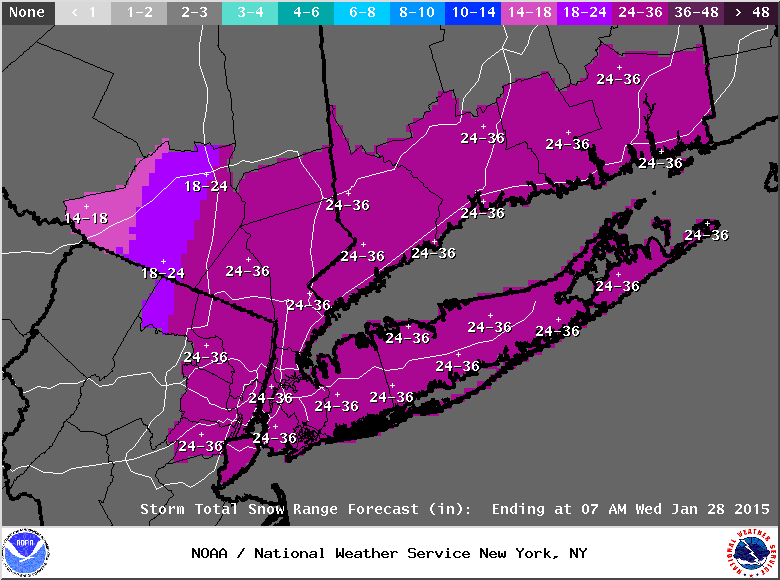
January 25th, 2015---: Well that escalated quickly. Well, potentially anyway. It's late and I'm pretty beat so I'll keep this short and sweet. The NYC Metro right now is under Blizzard Warnings (the first time in about 4 years!), and we could potentially be looking at upwards of 30 inches of snow here. I'm not banking on those higher amounts however, and the latest models are backing off slightly on this. Still though, that doesn't mean we won't see a significant snow storm here, with blizzard conditions at times, it just means it may not be the end of the world like many are thinking. Only time will tell. But in the meantime, below is the current official snow totals forecast issued by the NWS here in Upton, NY this evening. I can honestly say I've never seen totals like this. That would be amazing if it were to verify.

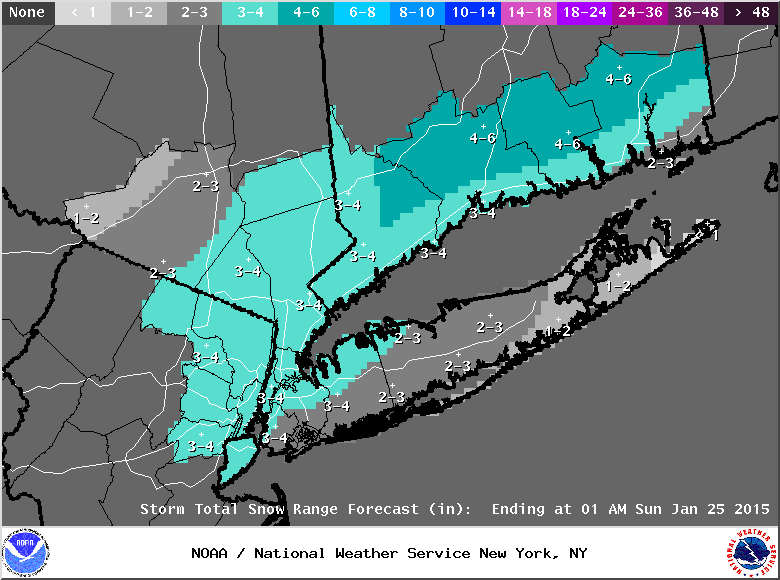
January 22nd, 2015---: The 00z runs last night, and the 12z runs today saw a rather dramatic shift from yesterday, and our significant winter storm, now looks more like a nuisance storm. With that said, the NYC Metro is still in line to receive a few inches of snow from this system, but that's about it. Yesterday I mentioned the lack of cold air in place, and the fact that there isn't a high pressure system to our north, funneling in cold air as the storm approaches, well, that is playing a big role in why storm total forecasts are being knocked down today. Right now at least it appears that we'll see a period of snow Saturday morning, and it could be heavy at times, but then freezing rain and rain should mix in for a time during the afternoon. It's still looking to be a very nasty day out regardless, so if you plan to be out and about, take precautions, and don't drive if you don't have to. The roads could very well be icy in spots. There is another snow threat from a Clipper system on Monday, but that's still a few days away, so I'll have more on that this weekend. Below is the latest snow fall totals forecast from the National Weather Service here in Upton, NY

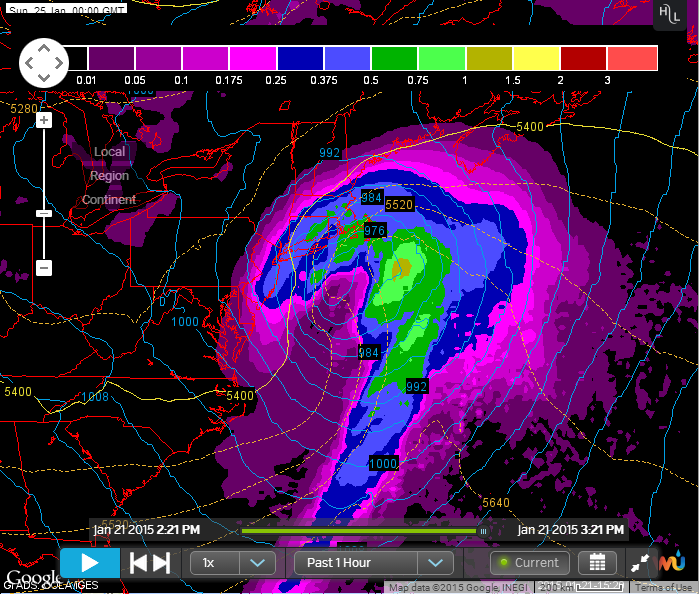
January 21st, 2015---: Our first significant winter storm of 2015 is looking more and more likely for this weekend. Right now there are still several unknowns, but the various forecast models are beginning to converge on a significant storm impacting my area, as well as other parts of the northeast this coming Saturday. If everything times out right, we could be looking at up to 10 inches of snow for parts of NYC and Long Island. Lots can still happen between now and then however, so nothing is for certain just yet. There are still questions regarding just how much cold air will be in place for this storm, without a strong high pressure system to our north, funneling in cold air, there may be mixing issues near the coast. Also, this will be a quick moving storm, so snow fall potential might not be maximized in our area. So again, lots of questions still remain. More updates to follow tomorrow! The two maps below are from today's 12z run of the ECMWF, showing a rapidly deepening low pressure system right over the all important 70/40 benchmark Saturday evening. Bottom map shows major accumulations for the big cities along the I-95 corridor.

